Genome-wide analysis identifies rare copy number variations associated with inflammatory bowel disease
Abstract
Background. Inflammatory bowel disease (IBD) is an idiopathic, chronic disorder of unclear etiology with an underlying genetic predisposition. Recent genome-wide association studies have identified more than 200 IBD susceptibility loci, but the causes of IBD remain poorly defined. We hypothesized that rare (<0.1% population frequency) gene copy number variations (CNVs) could play an important mechanism for risk of IBD. We aimed to examine changes in DNA copy number in a population-based cohort of patients with IBD and search for novel genetic risk factors for IBD.
Methods. DNA samples from 243 individuals with IBD from the Manitoba IBD Cohort Study and 2988 healthy controls were analyzed using genome-wide SNP microarray technology. Three CNV calling algorithms were applied to maximize sensitivity and specificity of CNV detection. We identified IBD-associated genes affected by rare CNV from comparing the number of overlapping CNVs in IBD samples with the number of overlapping CNVs in controls for each gene.
Results. 4,402 CNVs detected by two or three algorithms intersected 7,061 genes, in at least one analyzed sample. Four genes (e.g. DUSP22 and IP6K3) intersected by rare deletions and fourteen genes (e.g. SLC25A10, PSPN, GTF2F1) intersected by rare duplications demonstrated significant association with IBD (FDR-adjusted p-value < 0.01). Of these, ten genes were functionally related to immune response and intracellular signalling pathways. Some of these genes were also identified in other IBD related genome-wide association studies. These suggested that the identified genes may play a role in the risk of IBD.
Conclusion. Our results revealed new genomic loci associated with IBD, which suggested the role of rare CNVs in IBD risk.
Citation: Frenkel S, Bernstein CN, Sargent M, Kuang Q, Jiang W, Wei J, et al. (2019) Genome-wide analysis identifies rare copy number variations associated with inflammatory bowel disease. PLoS ONE 14(6): e0217846. https://doi.org/10.1371/journal.pone.0217846
Published: June 11, 2019
Copyright: © 2019 Frenkel et al. This is an open-access article distributed under the terms of the Creative Commons Attribution License, which permits unrestricted use, distribution, and reproduction in any medium, provided the original author and source are credited.
Data Availability: The list of the stringent CNVs detected in this study is available on the dbVar database at NCBI (https://www.ncbi.nlm.nih.gov/dbvar) under accession number nstd157.
Funding: This work was supported in part by the Health Sciences Centre Foundation, Mitacs, Manitoba Research Health Council and the University of Manitoba.
Competing interests: In the past four years, Dr. Bernstein has consulted to or served on advisory boards of Abbvie Canada, Shire Canada, Takeda Canada, Pfizer Canada, Janssen Canada, Ferring Canada, Napo Pharmaceuticals and Mylan Pharmaceuticals. In addition, he has received educational grants from Abbvie Canada, Janssen Canada, Shire Canada, and Takeda Canada. He has been speaker’s bureaus of Abbvie Canada, Shire Canada, Ferring Canada, and Medtronic Canada. Dr. Scherer is on the Scientific Advisory Committees of Population Bio and Deep Genomics. The other authors declare no conflict of interest for this manuscript. This does not alter our adherence to PLOS ONE policies on sharing data and materials.
Download: PDF
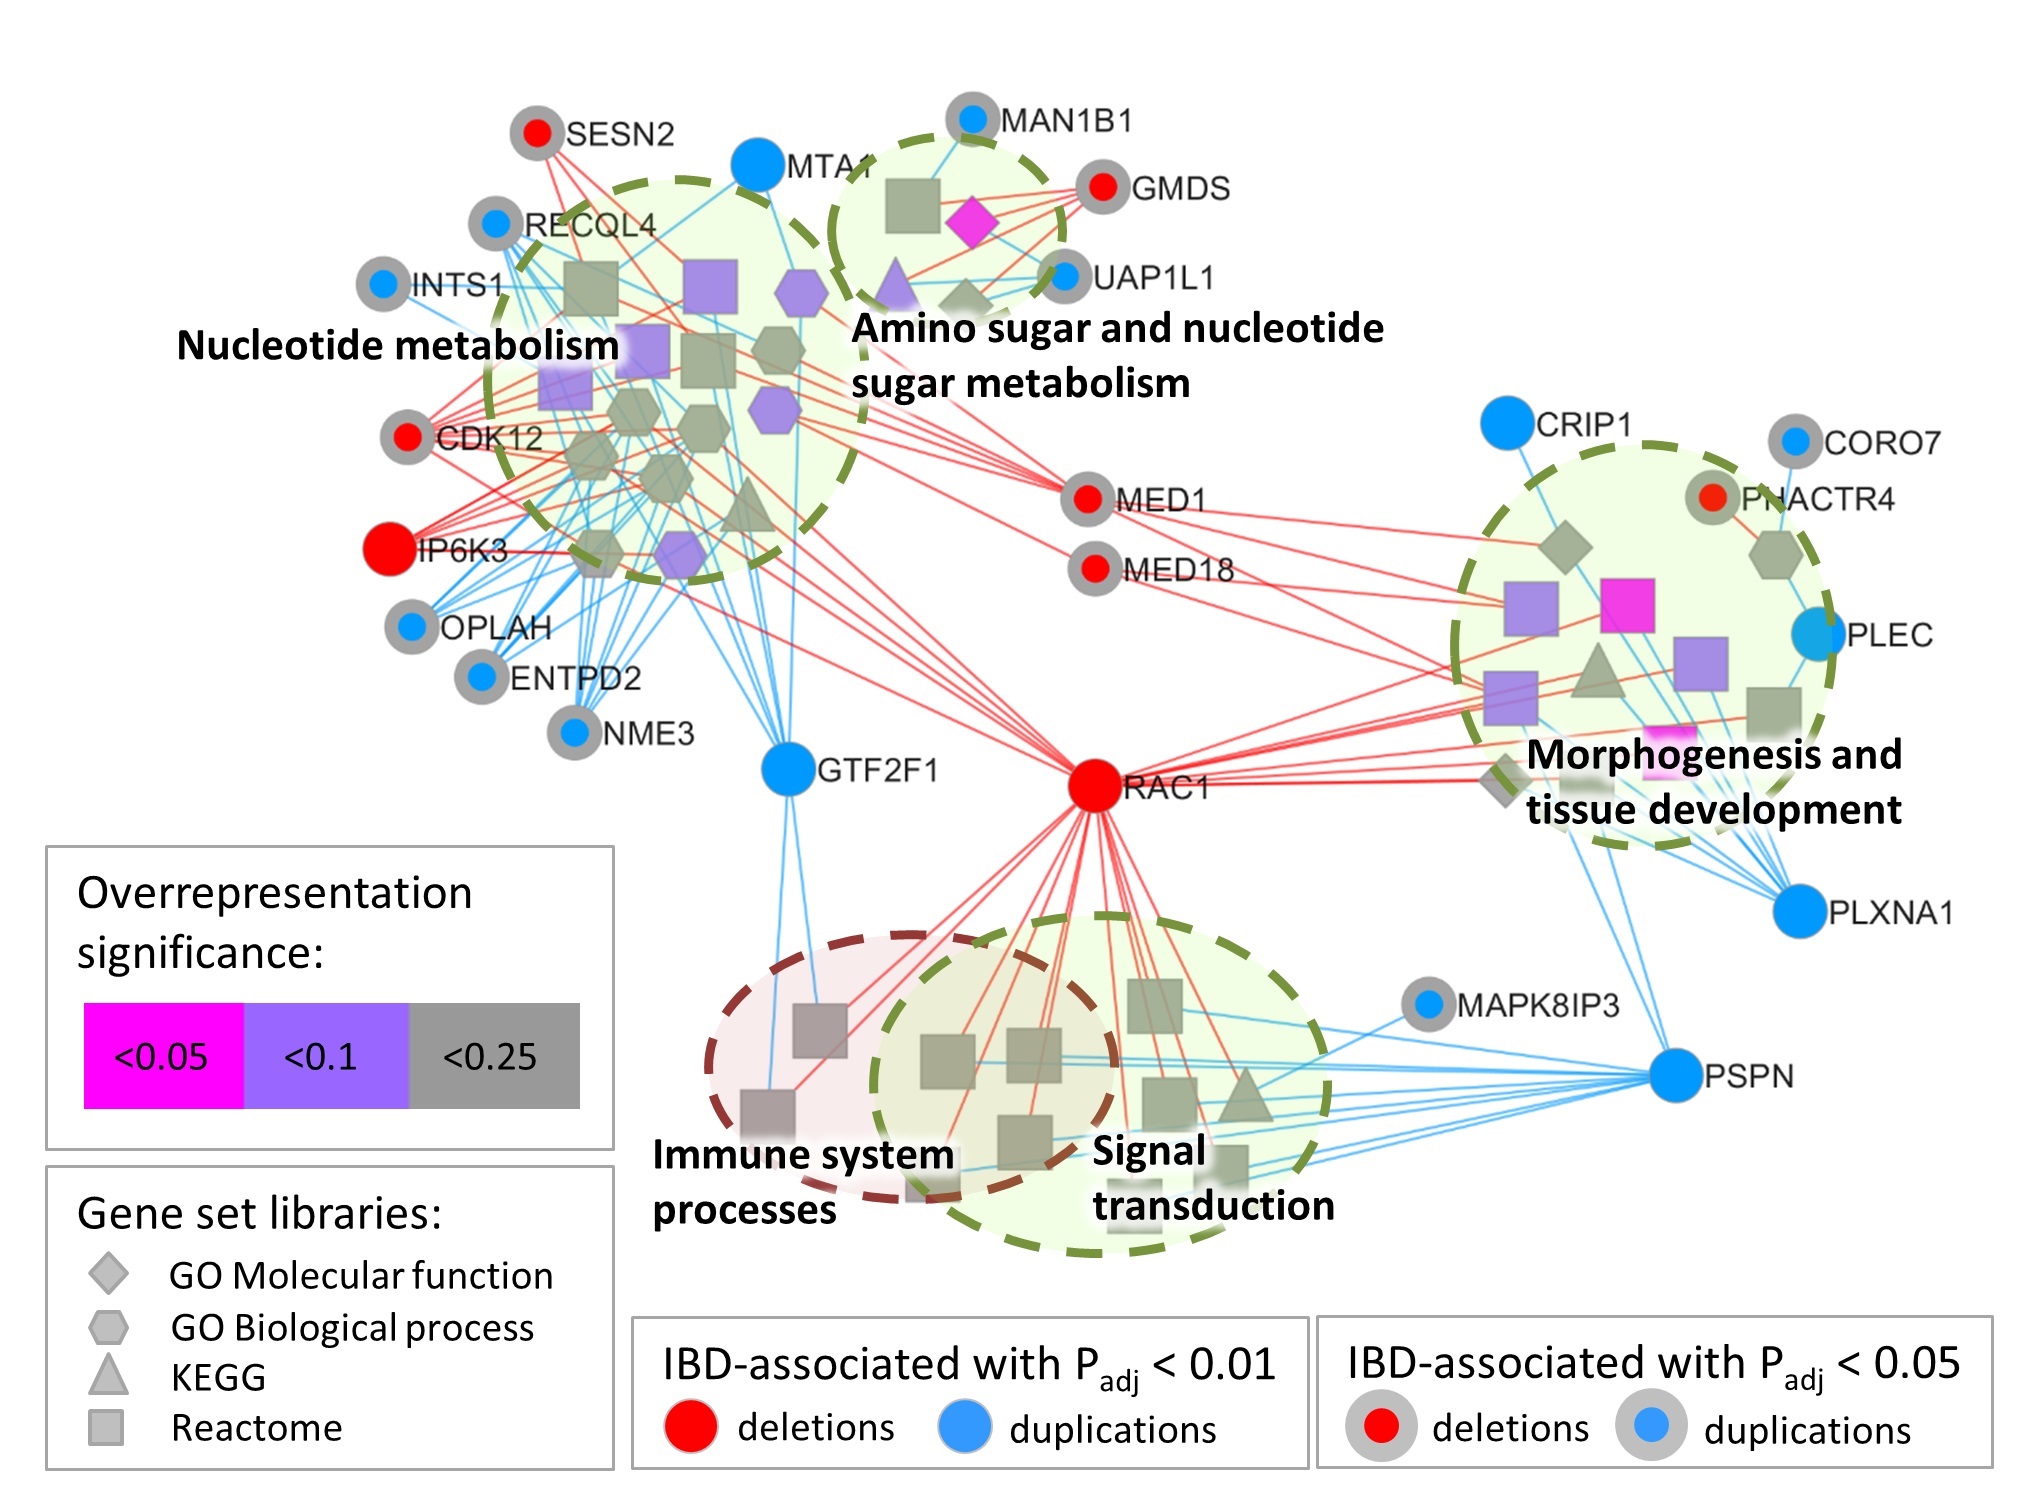
A gene set overrepresentation map.
Gene set overrepresentation analysis results were mapped as a network of gene sets (nodes shape corresponds to gene set library), related to the corresponding genes associated with IBD in the current study (circle nodes). The colour of the gene node indicates the type of CNV (deletion, red; duplication, blue) overlapped the gene in the current study. The colour of the gene set node corresponds to the p-value adjusted using the Benjamini-Hochberg method for correction for multiple hypotheses testing of gene set enrichment. The IBD-associated genes not implicated in the enriched gene sets are not shown. The edges represent the implication of genes in the enriched gene sets. See details in the publication.